Laser Texture Scanner 9400/9400HD
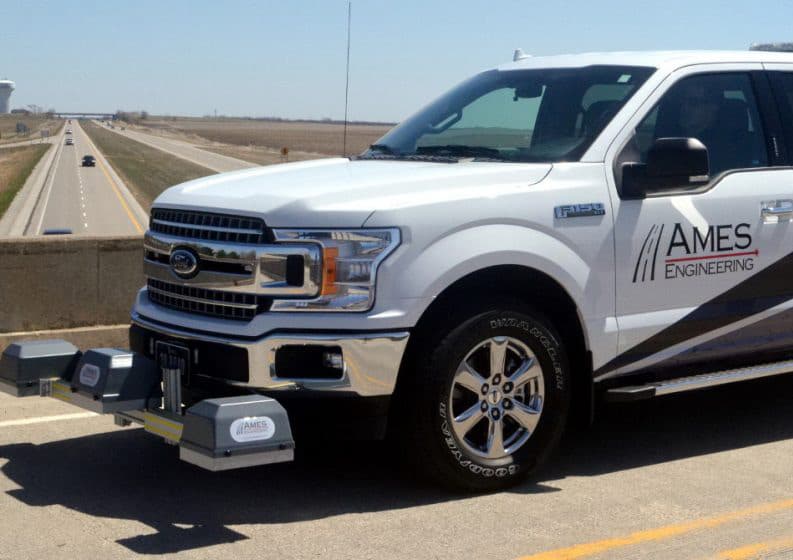
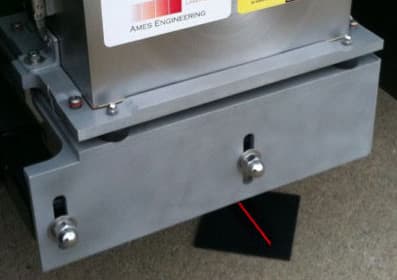
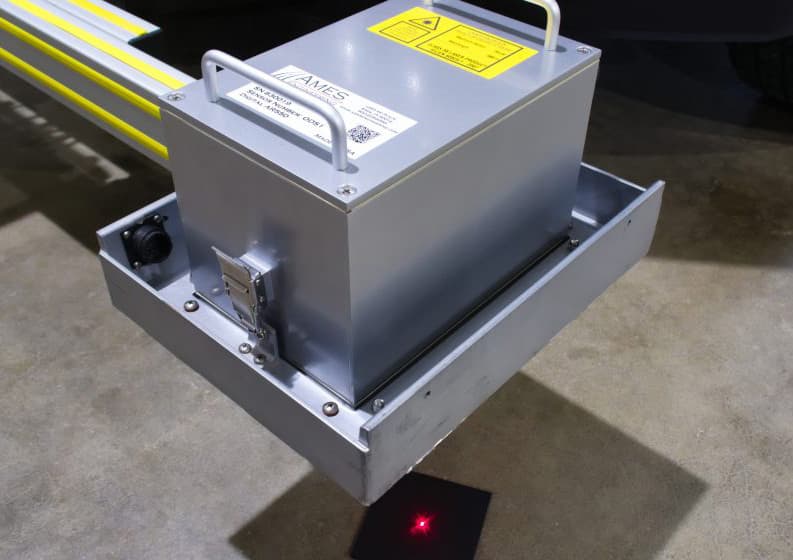
The Model 9400 Laser Texture Scanner scans and precisely measures the texture characteristics of any surface. This is our most accurate texture scanner with the ability to measure both Microtexture and Macrotexture, including excellent correlation with the Sand Patch Test. Read below for an article from CP2 Center News.
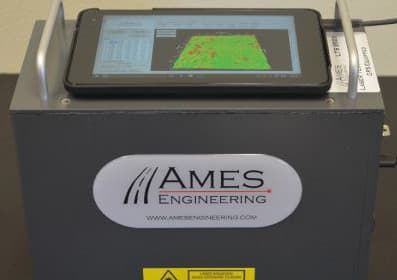
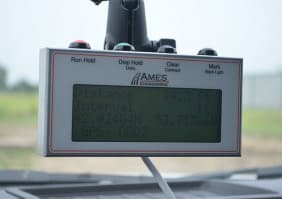
With the push of a button the unit automatically begins the scanning process, providing the operator with immediate and accurate texture measurements. Once a scan has been completed, the scanner calculates and displays the following indices on the sunlight readable LCD display:
- Mean Profile Depth (MPD)
- Texture Profile Index (TPI)
- Estimated Texture Depth (ETD)
- Slope and/or Elevation Variance with user selectable band pass filter
The completed scan data is easily downloaded to a PC through the Ethernet interface via the included Ames Texture Scanner software. The Texture Scanner software is capable of viewing and analyzing the proprietary LTS files, exporting to simple CSV data files, and configuring both scan densities and the performed texture index calculations.
The scanner is lightweight, portable and is powered by high cycle rechargeable batteries that can provide up to one hundred scans per charge.
9400 and 9400HD Common Characteristics
- Calculates Mean Profile (MPD), Texture Profile Index (TPI), Estimated Texture Depth (ETD), RMS, Ra, Rq, Skewness, Kurtosis and VAR. Scanner immediately displays the results on a sunlight readable LCD display
- Scan Area: 104.00 mm x 72.00 mm
- Data stored in binary .LTS file for downloading to PC for viewing in the Ames Texture Scanner software
- Software application has the ability to crop the original scans into smaller areas of interest
- Exportable CSV files are available for import into other applications
- Built in GPS Receiver
- Index units can be set to Metric or Imperial
- Backlit LCD for easy night-time viewing
- Data Storage: 2GB internal Flash, Downloadable to a PC through an Ethernet interface.
- Product Dimensions 152.4 mm x 228.6 mm x 205 mm(L x W x H) Weight: 4.2kg
9400HD Advantages vs 9400
- 3X faster scan speed at the highest resolution
- 5X better vertical resolution and 2X better length resolution
- Collects both elevation height data and scan intensity image
- Laser sensor automatically detects invalid spikes and removes them from the scan data
- More powerful laser allows more accurate measurement of dark surfaces
LTS9400 Texture Scanner Specs
- Vertical Resolution: 0.015 mm
- Measurement Range 50 mm
- Maximum Length Resolution: 0.015 mm
- Maximum Width Resolution: 0.0635 mm
- Triangulation Angle at center of range: 32°
- Dot size at center of range: 50 um
- Dot size at Max and Min range: 220 um
- Max laser sampling speed: 1 Khz
LTS9400HD Texture Scanner Specs
- Vertical Resolution: 0.003 mm
- Measurement Range 30 mm
- Maximum Length Resolution: 0.00635 mm
- Maximum Width Resolution: 0.0247 mm
- Triangulation Angle at center of range: 22°
- Dot size at center of range: 25 um
- Dot size at Max and Min range: 60 um
- Max laser sampling speed: 5 Khz
Below is an article from CP2 Center News about the Ames Texture Scanner!
Ames Laser Texture Scanner Correlates to Sand Patch Test
CP2 Center News, December 2013 Newsletter
Caltrans Using Fog and Rejuvenating Seals on State Highways for Preventative Maintenance
By Peter Vacura, Caltrans; Lerose Lane and Ding Cheng, CP2 Center
Caltrans completed another series of pilot fog seals projects during the 2013 construction season. Fog seals have required special permission from Caltrans Headquarters, since a moratorium was put in place in 1990s. This study was meant to re-establish best construction practices in an effort to lift the moratorium and allow use of fog seals on state contracts and it will also allow Caltrans the opportunity to develop new comprehensive specifications and guidelines for reviving the standard usage of fog seals for preventative maintenance, at a low cost.
In 2013, District 2 placed four pilot projects on Interstate 5. District 3 had two pilot projects, including one in Colusa County on SR 20, one in Glenn County on SR 45. District 10 placed three pilot projects, two of which were located in Tuolumne County on SR 120, and one in Amador County on SR 104. Pavement types which were seal coated included gap-graded, open-graded, and one dense-graded pavement. Various application rates of the fog or rejuvenating seals were used with testing conducted by Caltrans and the CP2 Center to evaluate the immediate surface characteristics of the fog seals. The projects application rates varied from 0.07 to 0.14 gal/ yd2. Table 1 shows the 2013 project location list which includes construction dates and pavement types.
The CP2 Center evaluated several different test methods for measuring friction and used statistical correlation of the results for their comparison, with the objective of maintaining an adequate skid resistance after the fog seal treatments. There was only one project, on
SR 120 that had dense graded pavement. The Center is working to tie the macro-texture numbers to skid resistance, both with and without sanding.
The Center used the LTS on the three projects that were placed in August. The correlation between the LTS and the sand patch is shown in Figure 1. The linear trend line in the figure shows that there is a direct relationship between the LTS and the sand patch test and a strong statistical relationship.
The Ring Test was performed to determine optimum emulsion application rate for a 20 minute break time. Figure 2 shows the emulsion at four different application rates.
The Laser Texture Scanner (LTS) was used to scan and precisely measure the texture component of the pavement surface. Once a scan has been done, the scanner immediately calculates the Mean Profile Depth (MPD) and is capable of showing a visual of the scanned results as well as a numerical result. This meter is portable and light weight which allows the data to be easily collected and stored.
The test method used was ASTM E 274. The skid trailer utilizes a measurement that is representative of the steady-state frictional force on a locked test wheel as it is dragged over a wetted pavement surface under constant load and at a constant speed. During testing, the major frictional plane is parallel to the direction of travel and perpendicular to the pavement. The values are initially measured in inch-pounds and converted to a coefficient of friction to evaluate a pavement’s skid resistance. To evaluate the change in the pavement’s skid resistance, a test needs to be performed both prior to the treatment and after the treatment.
To illustrate the importance of macrotexture at high speed, the friction speed curve shown in Figure 5 was developed using the constants developed by University of California Pavement
Research Center (UCPRC). Figure 5 shows that the higher the macro texture, the flatter the friction-speed curve and higher the friction at high speed. For low macro texture surfaces, the friction dropped significantly at high speed. Therefore, minimum macro texture level should be provided to ensure the safety of vehicles under high speed and wet pavement conditions.
Based on the testing results of the 2012 and 2013 skid and texture measurement, the recommended minimum macro texture for Open graded and Gap Graded RHMA are 1.15 and 0.75 mm, respectively. These two macro texture values are corresponding to skid numbers that are greater or equal to SN40 of 30 for ASTM skid trailer test. The summary of test results for open-graded and gap-graded pavement is shown in Table 2.
Conclusions
The following are conclusions from the study:
- The field evaluation showed that fog or rejuvenating seal treatment sections performed better than the untreated or control sections. The treatment reduced the raveling and minimized other distresses.
- Generally, the macro texture decreased when the fog seal application was applied.
- The emulsion breaking times from the ring tests using fog or rejuvenating seals were highly dependent on the temperature, climate, type of fog seal material, application rate, and pavement type. The pavement pilot projects demonstrated a 15-20 minutes emulsion breaking time to be optimum.
- Generally, skid resistance of the pavement surfaces decreased after the fog seal was applied, but then increased on the projects that included sanding or texture sealing with a copper slag product.
- High macrotexture surfaces generally have higher high speed friction than low macrotexture surfaces for the same type of pavement. Macrotexture is a very important parameter for increasing speed constant and friction number of the international friction index.
- For the 2012 and 2013 pilot projects, the range of texture levels for open-graded asphalt were from 1.15 to over 2 mm. Generally, the skid numbers of these open-graded pavement pilot projects were higher than Caltrans’ recommended minimum skid number of 30.
- For the 2012 and 2013 pilot projects, the range of texture levels for gap-graded asphalt were from 0.75 to 1.38 mm. The skid numbers of these gap-graded pavement pilot projects were higher than Caltrans’ recommended minimum skid number of 30.
Recommendations
To account for varying textures and pavement types the following recommendations are:
- A ring test (similar to CT 345) should be run to determine the appropriate application rate for the fog seal. This test determines the rate that provides adequate coverage and also has break time approximately 15-20 minutes.
- Good results can be attained when the fog seal is placed at the pavement temperature above 50oF, ambient temperatures above 60oF, no anticipated precipitation for 3-5 days.
- The higher the macro texture levels, the less the risk for safety issue due to high speed skid loss. Based on both the 2012 and 2013 Caltrans pilot project studies, a macro texture of 1.15 mm for open graded mixes, and 0.75 mm for rubberized gap-graded mixes typically resulted in friction numbers above 0.30.
- Sand should be applied to ensure the initial friction is adequate right after treatment.
A project report for the fog seals will be completed by the Center, and the individual projects will be placed into the Center’s database for future tracking.